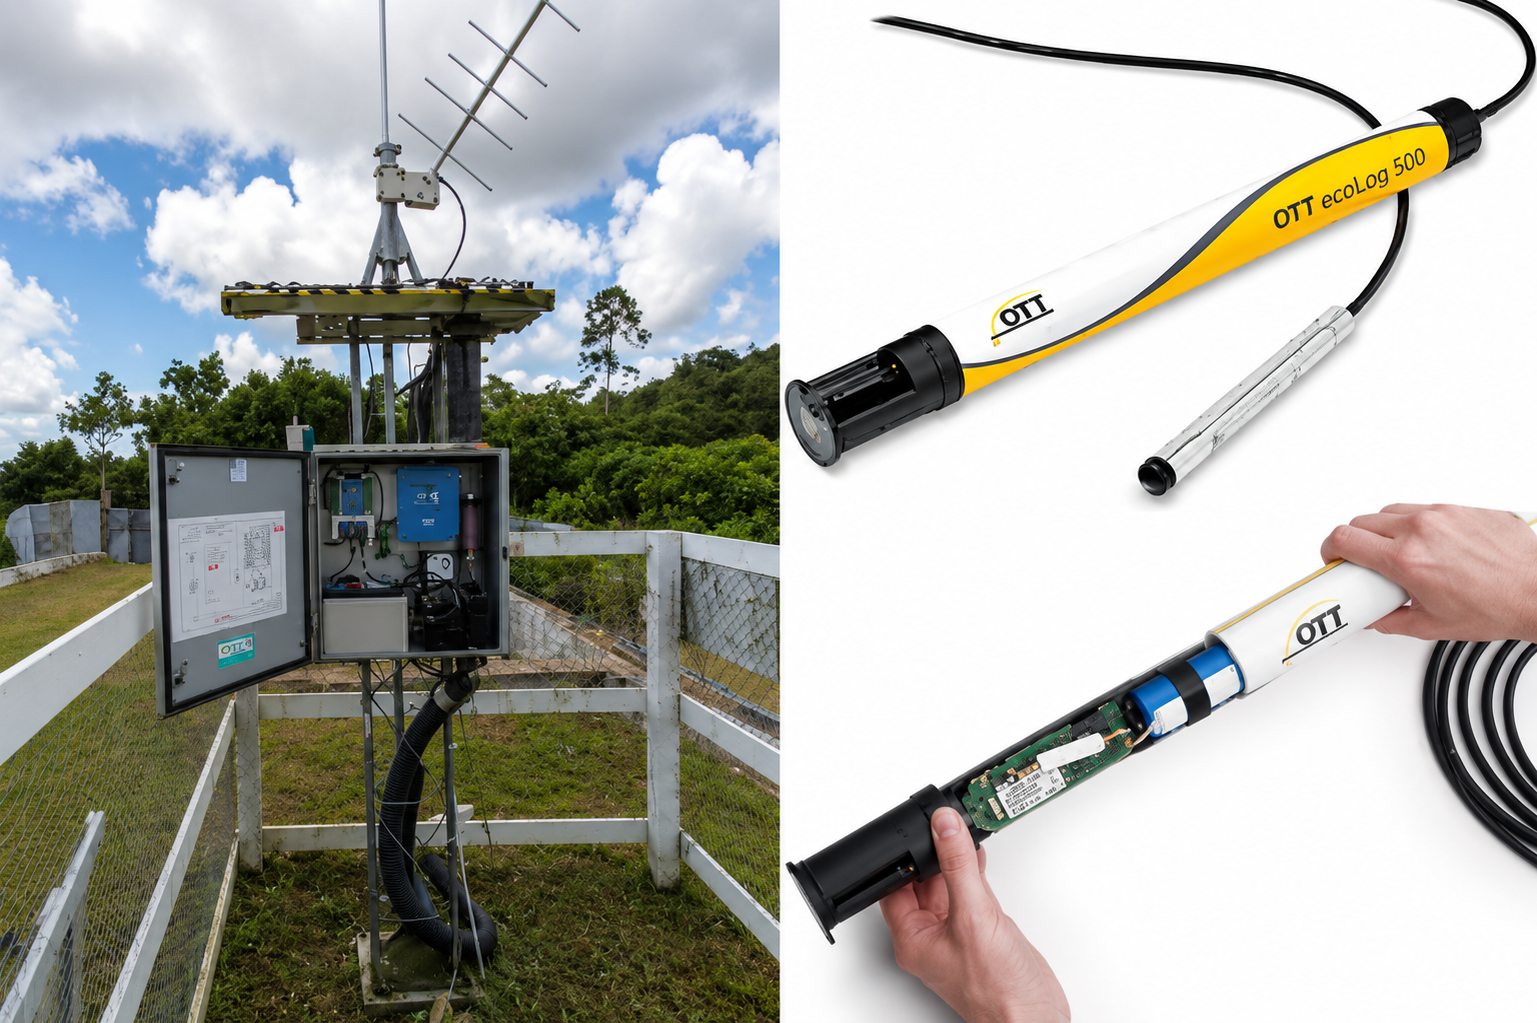
Our waterlevel monitoring network currently has 25 stations: 10 Automatic Water Level Stations and 15 OTT ecoLog data loggers. Specifically, we use six ecoLog 800 3G and nine ecoLog 500 3G devices. You can also view our station locations on Google Maps.
All our data is entered directly into ArcGIS. From there, we visualize it using StoryMaps and dashboards. These tools make our data accessible not only to policymakers but also to the public. You can explore our public dashboards using the links on this site.
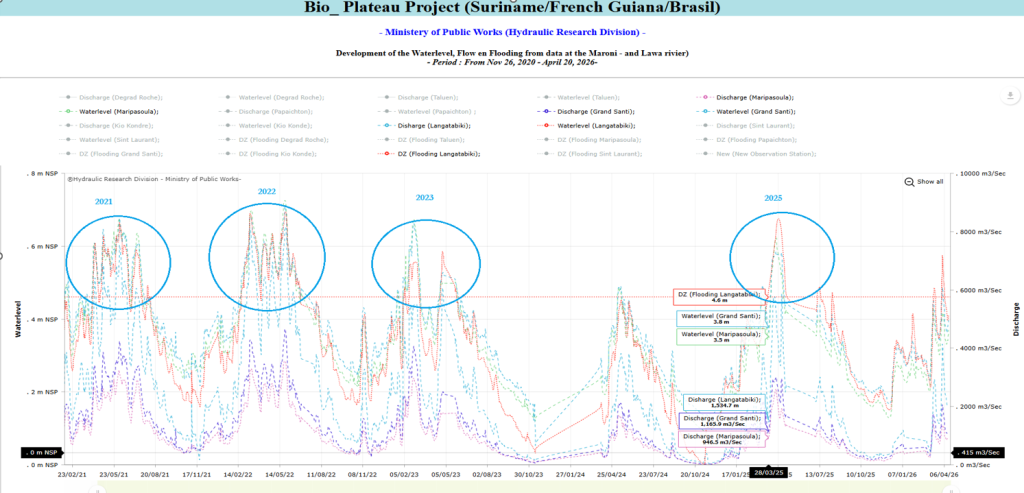
Through the BIO-Plateau Project, in collaboration with French Guiana, we’ve installed observation stations in the Maroni catchment area. These help us monitor the behavior of the border river.
Our Early Warning System helps reduce flood risks by providing timely warnings. This protects lives and property, supports emergency services, and contributes to climate adaptation efforts. It’s one of the most practical outcomes of our monitoring work. Looking ahead, we recommend expanding automated stations, strengthening the hydrological network, and improving real-time data collection. We also aim to enhance flood forecasting and early warning capabilities.
Left Automatic WaterLevel Station - Right Ecolog datalogger
WLA Water Level - Observation Stations
WLA Total Waterlevel Monitoring
Bio Plateau Locations
Thanks to our cooperation with French Guiana, WLA receives data from stations on the Marowijne, Lawa, and Tapanahony rivers. This cross-border data sharing is vital for understanding shared water systems.
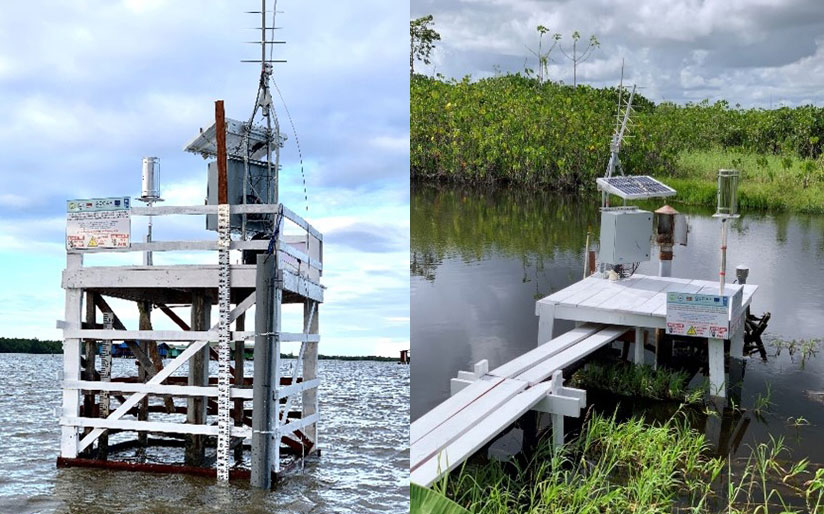
WLA Observation stations at Bigi Pan (left) and Nani Swamp (right)